Accounting automation ROI: your 2026 UK finance guide
By The AI Ledger editorial team | Published 2026-07-21 | Updated 2026-11-20
Accounting automation ROI is the percentage return your business earns from automating financial processes, calculated by dividing net savings by total investment cost. It sits alongside payback period and working capital impact as a financial measure, rather than a loose count of "time saved". Finance teams weighing automation projects need it to secure budget, set expectations and check whether the technology is delivering.
The main components of the return are:
- Labour cost savings from removing manual data entry, PO matching and exception chasing
- Error cost avoidance covering duplicate payments, late fees and missed early payment discounts
- Faster processing cycles that shorten invoice approval and month-end close
- Improved cash flow through better payment timing and discount capture
- Lower compliance and audit costs from cleaner documentation trails
- * *
What actually drives accounting automation ROI?
The same platform can give one finance team a strong return and another a modest one. The gap usually comes down to a handful of factors you can control.
Transaction volume and complexity come first. High-volume, rules-based processes such as accounts payable, bank reconciliation and recurring journals give the fastest and most predictable returns, for example through assistants like Amaya AI's finance assistant. The more invoices you process, the larger the absolute saving from each per-invoice gain.
!Finance professional reconciling invoices at desk

Labour cost calculations should use fully loaded figures. Employer National Insurance, pension contributions and overhead allocation all sit on top of salary. Using salary alone understates the case.
User adoption is where many implementations quietly fail. Automation built into existing workflows, with training and proper change management, generally does better than standalone tools that staff work around. Our piece on common workflow bottlenecks) covers the change side.
Other drivers include:
- Early payment discount capture: faster approval cycles make terms such as 2/10 net 30 achievable where they previously were not
- Supplier relationships: consistent, on-time payments reduce escalations and the hidden cost of payment disputes
- Error reduction: fewer keying and matching errors remove the downstream cost of finding and fixing mistakes
- Fraud prevention: payment controls built into automation platforms reduce exposure to invoice fraud
- * *
How to calculate your accounting automation ROI step by step
The formula is simple. Execution is where teams cut corners.
!Infographic showing step-by-step ROI calculation process
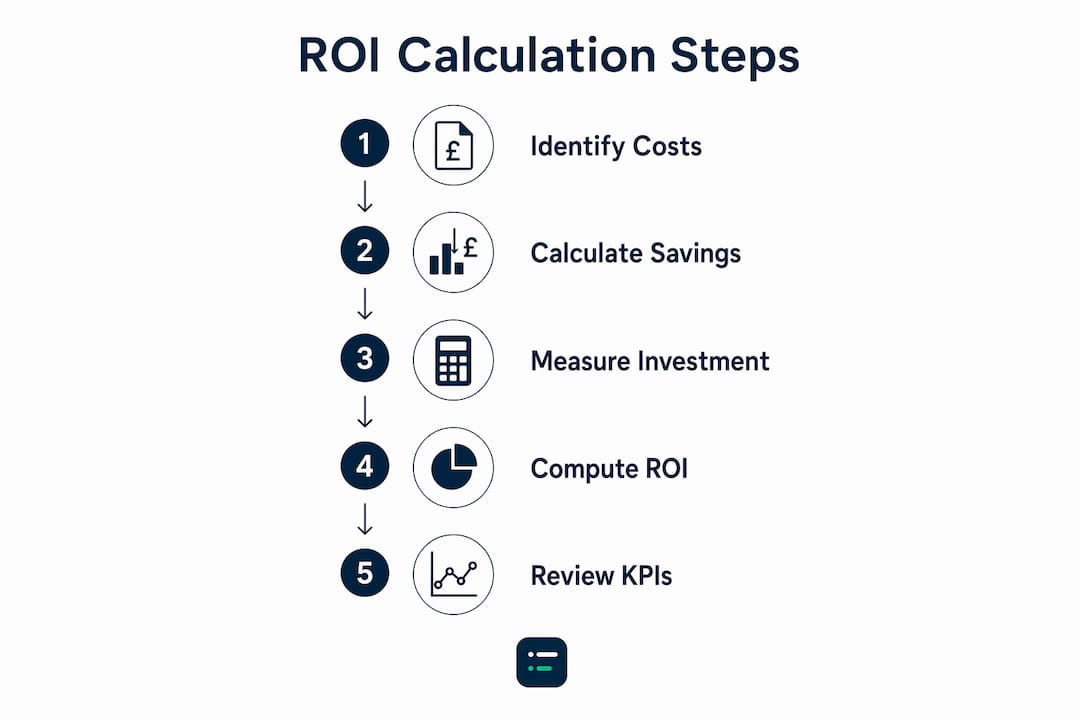
ROI (%) = (Net Savings ÷ Total Investment) × 100
Where: Net Savings = Total Annual Benefits - Total Annual Costs
The worked figures below are illustrations only. Replace them with your own numbers.
- Collect baseline data. Before touching any software, record your current state: hours spent on AP, reconciliation and close; cost per invoice (labour plus overhead); error rates and average cost per error; invoice cycle time; and early payment discount capture rate. Accurate baseline data is the most important input. Guesswork here costs you credibility with stakeholders.
- Identify all benefit categories. Split benefits into three tiers: direct (labour hours saved, error costs avoided, discounts captured), operational (faster close, fewer supplier escalations, less audit preparation) and strategic (finance staff moved to forecasting and analysis). Put a pound value on each where you can.
- Calculate fully loaded labour savings. Multiply hours saved by the fully loaded hourly cost of the staff involved. Illustration: removing 15 hours a week of AP processing at a fully loaded £35 an hour is 15 × £35 × 52 = £27,300 a year before any other benefit.
- Quantify error cost avoidance. Estimate your monthly error volume and average cost per error. Illustration: 1,000 invoices a month at a 2% error rate is 20 errors a month. At £50 to put each one right, that is 20 × £50 × 12 = £12,000 a year.
- Add early payment discount value. Take the annual payables volume where suppliers offer early payment terms, multiply by the discount percentage, and compare your current capture rate with a realistic post-automation rate.
- Total all investment costs. Include software licences, implementation fees, integration with your ERP or accounting platform, data migration, training and ongoing support. Do not use the subscription price alone; year one usually carries most of the one-off costs.
- Run the formula. Divide net savings by total investment and multiply by 100. A result above 100% means you have recovered your investment and made a surplus.
- Work out the payback period. Divide total investment by monthly net benefit. This tells you how many months until break-even.
- Keep tracking. ROI is not a one-off calculation. Measure the same metrics each quarter so you can show sustained value and spot where gains are slipping.
- * *
Which KPIs should you track to validate AP automation ROI?
Vendor dashboards report activity. Finance directors care about financial outcomes, so choose KPIs that map to the financial statements.
!Finance team reviewing KPI dashboard in office

| KPI | Definition | Financial relevance |
|---|---|---|
| Cost per invoice | Total AP operating cost divided by invoice volume | Direct SG&A line item; every £1 reduction drops to operating income |
| Exception rate | Percentage of invoices requiring manual intervention | Leading indicator of future SG&A trajectory |
| Invoice cycle time | Average days from receipt to payment approval | Determines early payment discount capture and cash outflow predictability |
| Days Payable Outstanding (DPO) | Average days taken to pay suppliers | Balance sheet metric affecting working capital and free cash flow |
| Early payment discount capture rate | Percentage of available discounts actually taken | Direct income statement impact; measurable in pounds per year |
| Duplicate payment rate | Percentage of payments made more than once | Non-operating loss or SG&A variance requiring explanation |
| Forecast accuracy (MAPE/WAPE) | Variance between predicted and actual cash outflows | Determines buffer cash requirements and borrowing costs |
| Touchless processing rate | Percentage of invoices processed without human intervention | Proxy for automation maturity and future headcount planning |
Good practice for KPI tracking:
- Lock baselines before go-live. Every KPI needs a pre-automation benchmark. Without one, improvement claims cannot be checked.
- Group metrics by financial statement. Income statement (cost per invoice, exception rate, discount capture), balance sheet (DPO) and cash flow (forecast accuracy).
- Track by cohort. Segment by business unit, supplier tier or invoice type so implementation noise does not hide real improvement.
- Review at 30, 60 and 90 days. Adoption and quality metrics usually move first, then throughput, then financial outcomes.
Our guide to finance automation metrics covers each of these in more detail.
- * *
Benefits beyond the headline numbers
Cash flow becomes more predictable. When invoice cycle times shorten, whoever manages cash can see the payment queue further ahead. That predictability reduces the need for precautionary cash buffers.
Audit readiness improves. Automated workflows keep complete, timestamped audit trails without extra effort. Automated financial reporting) cuts the time spent preparing for audit.
Other benefits:
- Supplier relationships: consistent, on-time payments build goodwill and can help when negotiating terms
- Staff retention: removing repetitive data entry makes finance roles more rewarding
- Scalability: a manual team needs more headcount as volumes grow; an automated team can absorb more of that growth
- Better decisions: when staff stop spending their time validating the basics, they can move to forecasting and business partnering
- Resilience: automated processes depend less on one person's knowledge, so absence and turnover hurt less
- * *
How mature finance teams measure automation ROI
Many teams report hours saved, invoices processed and cost-per-invoice trends. Then the finance director asks what it means for working capital and nobody has an answer.
A better approach is to measure automation's effect on the process metrics you already report: days to close, DPO, forecast accuracy and SG&A. The question moves from "what have we automated?" to "what has changed in the quality of our work?"
A layered approach works well. Start with adoption (is the system being used?), then throughput (is work flowing faster?), then quality and controls (can you defend it to audit?), then financial outcomes. Each layer builds the evidence for the next.
Principles worth keeping:
- Link every metric to a financial statement line. A sentence such as "AP operating costs fell from £X to £Y a year" lands better with a board than a percentage on its own.
- Avoid volume metrics as ROI proof. Counting automations built, or processes "100% automated", pushes teams to automate what is easy rather than what matters.
- Treat automation as an ongoing capability. Keep tracking quality and predictability after the project closes.
- Look at broader automation over time. Hyperautomation in finance, as Oracle describes it, combines several automation and AI tools across systems so exceptions can be predicted rather than just processed faster.
For the quarterly report, use three sections (income statement, balance sheet, cash flow) and one headline figure: "Automation contributed £X to operating income this quarter."
- * *
What published studies show
Published ROI figures vary widely and are often vendor-funded, so treat them as context rather than a forecast for your firm.
Forrester's Total Economic Impact work on finance automation modelled a fictional global enterprise adopting modern accounts payable automation, which achieved an ROI of 111% with payback in under six months. That is a composite model of a large organisation, not a UK practice, and integration costs and data quality will move your own result in either direction.
The pattern that holds is simpler: teams that start with high-volume, rules-based processes, get people using the system and track KPIs tied to the financial statements can show a return. Those that deploy without baseline data or clear KPI ownership rarely can.
- * *
Automation vs manual processes: where the gap comes from
The case for automation is only partly about speed. It also rests on error costs, hidden labour and the opportunity cost of finance staff doing work that adds no analytical value. When staff spend their time on data entry, exception chasing and payment status calls, they are not building forecasts, analysing variances or supporting commercial decisions.
| Dimension | Manual processing | Automated processing |
|---|---|---|
| Cost per invoice | Your baseline | Measure after go-live |
| Error rate | Dependent on keying and checking | Reduced by matching and validation rules |
| Early payment discount capture | Limited by cycle time | Easier with shorter cycles |
| Fraud exposure | Higher (manual controls) | Lower (automated policy enforcement) |
| Scalability | Headcount grows with volume | Volume growth with less extra hiring |
| Audit trail quality | Inconsistent, manual | Complete, timestamped, automatic |
The role of AI in financial operations) takes this further: AI tools can flag anomalies, learn from exceptions and connect data across systems.
The gap also tends to widen over time. Manual processes degrade as volume grows: errors and exceptions multiply and the cost of manual controls rises.
- * *
Key takeaways
| Point | Details |
|---|---|
| ROI formula | Net Savings ÷ Total Investment × 100; use fully loaded labour costs, not salary alone. |
| Published benchmarks | Mostly modelled or vendor-funded; use them as context and base your case on your own baseline. |
| KPI selection | Track about eight metrics across cost, accuracy, cycle time and cash; link each to a financial statement line. |
| Baseline data | Collect pre-automation time, error rates and cycle times before go-live. |
| Start where volume is | High-volume, rules-based processes such as AP and bank reconciliation give the clearest return. |
For practical starting points, see accounting workflow automation examples for 2026.
- * *
Find the right automation tools for your practice
The AI Ledger directory covers 300+ AI accounting tools, grouped by task, including data entry and receipts, bank reconciliation and month-end close. You can compare tools side by side, or use the finder to get a shortlist for your software stack and practice size. For month-end automation, the Double listing is one place to start.
Sources
- Forrester, The ROI of finance automation, quantified (111% ROI and under six months payback, for a modelled fictional enterprise)
- Oracle UK, Hyperautomation
- Amaya AI, Finance assistant
Recommended
- Finance automation metrics to track in 2026
- Accounting workflow automation examples for 2026
- Automated financial reporting: a guide for finance teams)
- How to build accounting workflow templates in 2026)